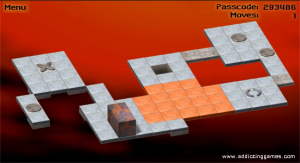
As an experiment, I decided to see if I could approximate a Flash game in JavaScript and HTML (without using the non-standard CANVAS tag). It turns out to be pretty easy to replicate an isometric display using some simple 2D graphics techniques.
The Game
As my example, I chose an old favorite: Bloxorz. This was an easy example because the game is turn based, meaning that it doesn’t require complicated asynchronous game logic to drive the graphics. Furthermore, I’d already built a solver for the game, so I had level data and simple presentation logic in hand.
The Graphics
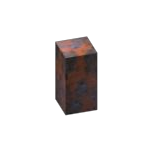
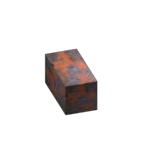
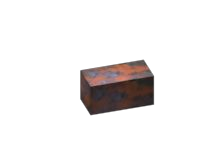
Bloxors levels are drawn by combining a small set of image files into a game screen. The image files are chosen from a pool of over 500 images, but once you discard the background image, user interface graphics, shadows, block animations, and bridge animations, you’re left with just 9 core images:
The trick to rendering a level is simply to place copies of these graphics at the correct screen locations, and then to draw them in the proper order.
(Since we’re only approximating the game, I feel comfortable jettisoning 98% of the data files, and probably 85%+ of the rendering code, when that code and data has only a marginal impact on the appearance of the game. )
The Display List
In general terms, a display list is a series of instructions to a graphics sub-system. In this application, I encode the display list as the child nodes of a particular DIV. This arrangement allows a controlled sequence of simple graphics commands to be executed.
Browsers seem to consistently render child nodes beginning with the first node on the list and ending with the last; this arrangement allows us to create a display list that will reliably render a scene from back to front. Back-to-front ordering is necessary to make occlusion (e.g. the fact that tiles hide the front edges of the tiles behind them) and translucency (e.g. tile highlights) work properly.
The display list is populated beginning with the cells in the top row, and then row-by-row towards the bottom row. The cells in each row are processed from right to left. Each cell can generate up to two display list elements: One for the tile itself, and a second for any colored highlight associated with the tile. (The highlight goes on the display list after the tile image.) The block image is placed on the display list last.
The logic behind this ordering is:
- If cell A is to the left of or below cell B, then A may occlude B, but B will never occlude A; B should be drawn first
- If a cell is highlighted, the highlight must be drawn after the tile
- The block may occlude anything, and is occluded by nothing
Each element on the display list is an image (usually an IMG tag) positioned with respect to its parent’s client area. In other words, the display list is made up exclusively of instructions of the form: “Draw bitmap B at offset (x, y) in the parent’s client area”. The question of which bitmap to draw is resolved with a simple lookup; if a cell is a “splitter” tile, for instance, simply use a picture of that tile. The question of what x and y to use, however, is a little more complicated.
The Transformations
In mathematical terms, the process of moving from a tile-based co-ordinate system to a screen-based system is a change of basis vectors. The tile-based system has basis vectors S and T such that:
- 0*S + 0*T represents the upper-left-hand tile of an NxN map
- N*S + 0*T represents the upper-right-hand tile of an NxN map
- 0*S + N*T represents the lower-left-hand tile of an NxN map
- N*S + N*T represents the lower-right-hand tile of an NxN map
(Note that all game maps in the solver are laid out on a 17×17 grid, and that no game map actually makes use of the [0, 0] cell.)
The screen-based system has basis vectors X and Y such that:
- [0, 0] represents the upper-left-hand pixel of a DIV’s client area
- X represents a 1-pixel move towards the right
- Y represents a 1-pixel move towards the bottom
To generate a transition matrix from {S, T} to {X, Y}, we need to express S and T in terms of X and Y. By taking screenshots and overlaying them in Photoshop, I was able to experimentally determine that a 1-tile shift to the right resulted in a 32 pixel shift to the right, and 5 pixel shift up – i.e. that S = 32X – 5Y. Similarly, I found that T = 10X + 16Y. This yields a simple transformation matrix of:
| 32 | 10 |
| -5 | 16 |
Of course, this matrix puts the upper-left cell of the tile grid at the upper-left corner of the display, which isn’t what we want. Experimentally, I found that a shift of (-77, 62) placed tile graphics in the correct position, and that a shift of (-153, -28) placed block art in the correct position. (Tile graphics and block graphics are centered differently in their bitmaps.)
The upshot of all this is that a tile position (s, t) can be converted to a screen position (x, y) suitable for use in the display list with the following formulas:
- For a tile: (x, y) = (32s + 10t – 77, -5s + 16t + 62)
- For a block: (x, y) = (32s + 10t – 153, -5s + 16t – 28)
An Aside: Z-Index
An alternative approach to creating the display list would be to use the CSS z-index property to order the nodes from back-to-front. I chose not to develop this technique for two reasons:
- I’m not sure how widely z-index is supported; simple child node ordering seems to work everywhere
- It’s not really any less work to use z-index; the nodes must still be assigned an ordering
Nevertheless, I thought it worth mentioning.
Complications
Unfortunately, the implementation of the idea is a little more complicated than the telling. Some of the complicating factors:
- The solver supports a top-down as well as an isometric view
- The display list must be modified from time to time
- IE6 requires special handling
- Images are pre-loaded
As a result, I don’t have a nice, short, code snippet to share. I can point to the solver’s source code, however, and direct your attention to the Render() functions – particularly Solver.Board.prototype.Render() – which contain all the code to place a game board on the screen.
Why JS/HTML can’t replace Flash
It’s interesting to consider how far this approach could be taken. In my opinion, “not very far”. There are several things that JS/HTML doesn’t do nearly as well as Flash, which limit the extent to which “Flash-like” effects can be replicated in the browser proper:
- Dreadful sound support. Sound effects are much more important to the overall user experience than one might think, and HTML offers almost no support for them. This issue doesn’t look like it will be resolved any time soon.
- Unreliable interrupts. The setInterval() and setTimeout() functions are the only real means JS provides for asynchronous behaviour. Unfortunately, some browsers (I’m looking at you, FF2) can stop servicing the event queue for longish (~1s) periods at frequent (~15s) intervals. This makes reliable, smooth, cross-browser animation almost impossible. This problem might get better as browers evolve, but I’m not optimistic.
- No sprite rotation. The ability to roll an image is a basic 2D graphics trick, and HTML/CSS offers no support for it. I imagine the CANVAS tag offers this feature, but CANVAS is non-standard.
With those (major) caveats, however, you can do some pretty neat 2D graphics stuff in the browser. I’m hardly the first one to notice this, of course.


